
 ไทย
ไทย
When using a VPS (Virtual Private Server) for hosting websites, running applications, or providing other services, it is crucial to ensure your server operates smoothly, does not overload, does not use all of its RAM, and maintains a stable network connection. In this article, VisperHost will guide you through 5 essential commands for checking system status on a Linux VPS that you need to know!
1. top: Check Load and real-time resource usage
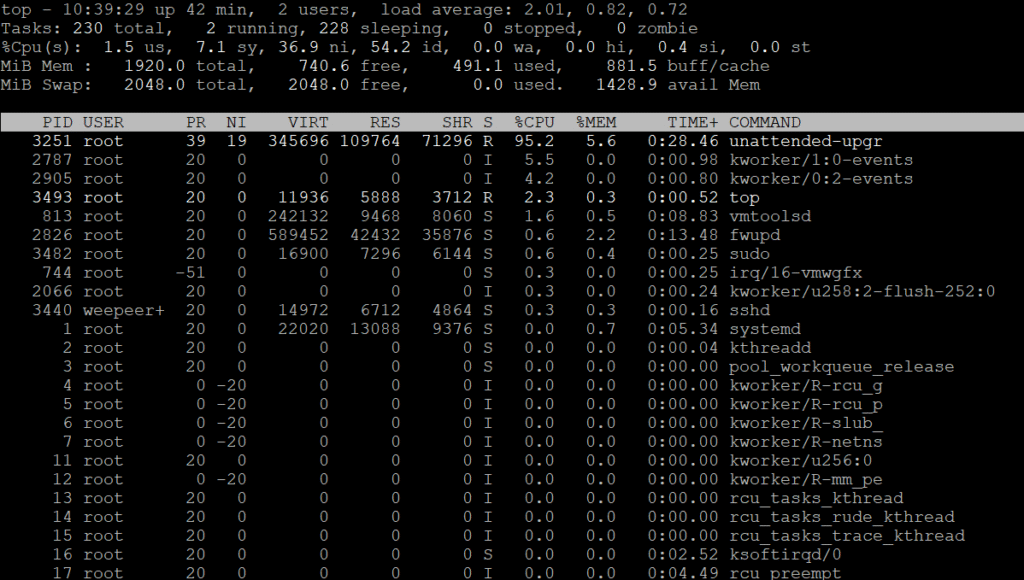
The top command is one of the most essential tools for Linux administrators to monitor system performance in real time. It updates information every few seconds (the default is 3 seconds) , allowing you to instantly view CPU usage , RAM, swap, and active processes.
Basic Usage
Top
When you enter this command, the information will appear in a table divided into the following sections:
Line 1: General System Information
top - 14:05:23 up 1 day, 4:12, 1 user, load average: 0.35, 0.42, 0.38
14:05:23: Current system time1 day, 4:12: The system has been running for 1 day, 4 hours, 12 minutes (Uptime).1 user: Number of users currently logged inLoad average: 0.35, 0.42, 0.38:- Average Load in the last 1, 5, and 15 minutes
- This value should be closer to 1 (for 1 core) or closer to the number of CPU cores for better performance.
- If the VPS has 2 cores → The value should not exceed 2.00
Line 2: Information about the Task (process)
Tasks: 114 total, 1 running, 113 sleeping, 0 stopped, 0 zombie
114 total: Total number of processes1 running: The number of processes currently running.113 sleeping: A process that is in an idle state, waiting.zombie: A process that has terminated but has not yet been removed (should be 0).
Lines 3–5: CPU Usage
%CPU(s): 5.0 us, 1.2 sy, 0.0 ni, 92.8 id, 0.0 wa, 0.0 hi, 1.0 si, 0.0 st
us(user): CPU usage by general processessy(system): Usage by system/kernelid(idle): CPU is idlewa(I/O wait): The CPU is waiting to read or write data from the disk.st(steal): CPU is being used by the hypervisor (found in some VPS/cloud services).
Line 6–7: Memory (Memory / RAM / Swap)
MiB Mem:  1998.2 total,   980.5 free,   620.4 used,   397.3 buff/cache
MiB Swap: 1024.0 total,  1024.0 free,     0.0 used.  1230.5 avail Mem
Total: Total memoryUsed: Currently in useFree: Availablebuff/cache: Reserved for temporary use by the system (the system will reclaim if needed)
Key point: Look at avail Mem → This is the remaining RAM available for new processes.
Lower section: Process list
Example:
PID USER     PR  NI    VIRT    RES    SHR S  %CPU  %MEM     TIME+ COMMAND
1234 root     20   0 500,000 12,000 3,000 S 5.3 0.6 0:12.34 apache2
Description:
PID: Process numberUSER: Process ownerPR: Priority of process%CPU: Percentage of CPU usageCOMMAND: process name
Press P to sort by CPU, M to sort by RAM
2. free -m: Check RAM and Swap usage
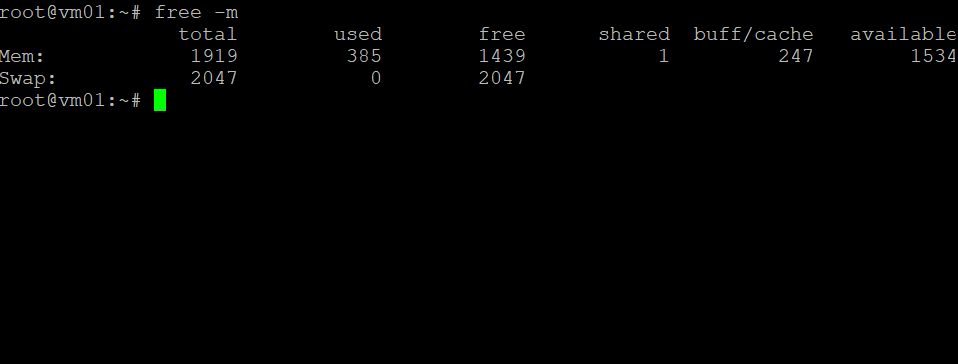
The free command is used to check the usage of memory (RAM) and swap space, which helps you determine if your VPS is nearing capacity.
free -m
-mdisplays results in MB units.- Check the
used,free, andavailablelines to decide whether you should add RAM or improve your applications.
Result Description
Example of the command’s output:
             Total Used Free Shared Buff/Cache Available
Mem: 1998 978 300         100 720 1200
Swap: 1024 50 974
What does each column represent?
- Total: The total amount of memory that the system has.
- Used: The amount already in use by the system (including buffers/cache)
- free: Memory that is still available
- shared: The portion allocated for use by multiple processes.
- buff/cache: Memory reserved by the system for performance
- Available: Memory that is actually ready for use by a new process.
3. Uptime: Quick check of Load Average status
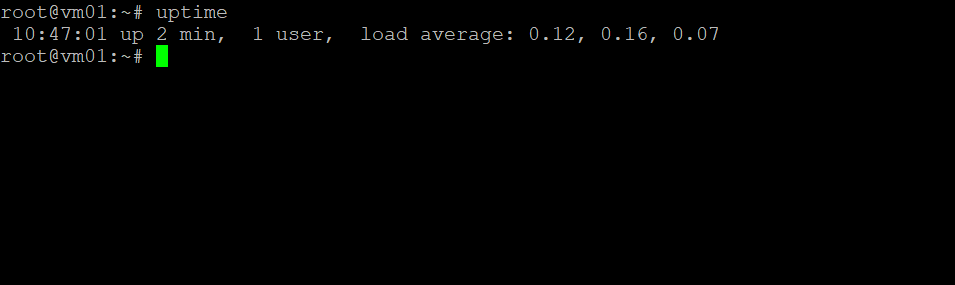
If you just want to quickly check the Load Average, the uptime command is a fast option.
uptime
Displays the duration the system has been running, along with the latest 1-minute, 5-minute, and 15-minute Load Average values, which help indicate whether the system is overloaded.
4. vnstat: Check Bandwidth Usage
If you want to see how much internet data your VPS uses each day, month, or during a specific period, the vnstat command is very suitable.
vnstat
If not yet installed, you can install it with:
sudo apt install vnstat
Display information such as:
- Upload/Download Data Volume
- Usage can be viewed by day, month, or in real-time (use
vnstat -l)
5. netstat -tuln or ss -tuln: Check the status of network connections.
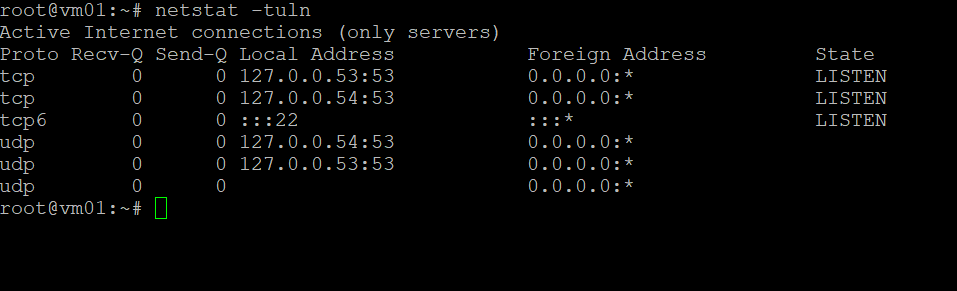
This command helps you determine which services are running and which ports they are listening on your VPS.
netstat -tuln
# หรือ
ss -tuln
t= TCPu= UDPl= Listening (Currently accepting connections)n= Display the port number instead of the service name
This command helps analyze active ports and can also be used to control access for security purposes.
Summary:
Regular maintenance of your Linux VPS helps ensure system stability, prevents potential issues, and allows for efficient system expansion planning. Don’t forget to save these commands for future use:
Topfree -mUptimevnstatnetstat -tulnorss -tuln
If you’re looking for high-quality VPS with professional support, don’t forget to consider VisperHost.net, the VPS provider that understands Thai people the most!
